
How data has harnessed Cloud-based Platforms to Surge Growth
Digital data is growing at an explosive pace, thanks to larger, faster, and more affordable storage solutions. Businesses have harnessed cloud-based platforms to collect massive amounts of data since Google and Facebook began doing so in the early 2000s. And data generation can only grow even more enormously as the world’s population gains internet access. Global data is predicted to exceed 180 zettabytes by 2025, up from 64.2 zettabytes in 2020. This figure results from the daily creation of 402.74 million terabytes or 403 trillion megabytes of various sorts of data—generated, collected, and copied.
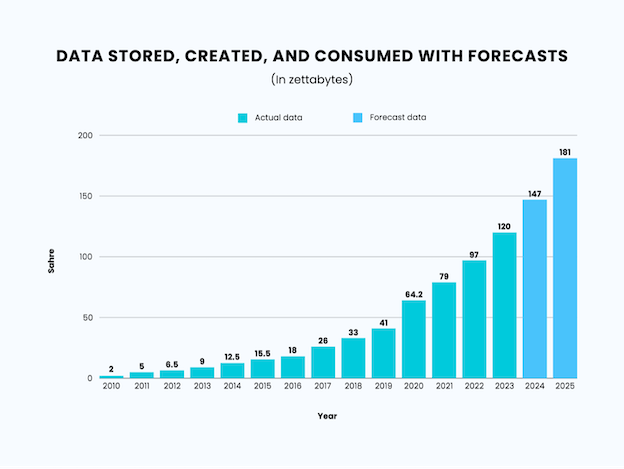
| Year | Data Stored, Created, and Consumed
(In zettabytes) |
| 2010 | 2 |
| 2011 | 5 |
| 2012 | 6.5 |
| 2013 | 9 |
| 2014 | 12.5 |
| 2015 | 15.5 |
| 2016 | 18 |
| 2017 | 26 |
| 2018 | 33 |
| 2019 | 41 |
| 2020 | 64.2 |
| 2021 | 79 |
| 2022 | 97 |
| 2023 | 120 |
| 2024 | 147 |
| 2025 | 181 |
Source: https://www.statista.com/statistics/871513/worldwide-data-created/
Rapid data growth has also forever changed the way companies manage data. Formerly just a byproduct of business operations, these diverse, high-volume, and growing datasets—called big data—are crucial for solving problems and decision-making.
Below is a timeline of data management tool milestones from the 1990s to the present listed by management consultant and AI readiness coach Achim Lelle.
| Year | Milestone | Added Value | Key Players |
| 1990s | Introduction of relational database management systems | Structured data storage and efficient querying | Oracle, IBM, Microsoft |
| Late 1990s | Advent of data warehousing and online analytical processing | Enabled complex analytical computations involving large datasets | SAP, Oracle, IBM |
| Early 2000s | Emergence of big data tech | Ability to process and analyse vast quantities of unstructured data | Apache Hadoop, NoSQL databases |
| Mid-2000s | Rise of cloud computing | Scalable, on-demand data storage and analytics | AWS, Google Cloud, Microsoft Azure |
| 2010s | Advancements in AI and machine learning | Enhanced predictive analytics and decision-making | TensorFlow, PyTorch, Google AI |
| Adoption of data lakes | Flexible storage for unstructured and structured data, supporting advanced analytics | Various cloud providers, Hadoop ecosystems | |
| Proliferation of BI tools | Democratised data analysis capabilities | Tableau, Power BI, Qlik | |
| 2010s to 2020s | Integration of IoT and real-time analytics | Real-time data collection and analysis from connected devices | AWS IoT, Azure IoT |
| Late 2010s to 2020s | Introduction of data meshes | Decentralised data architecture focusing on domain-oriented data ownership and accessibility | Thought leaders in data architecture and organisations adopting a decentralised approach |
So where do we go from here? This article will discuss the trends shaping the data landscape.
6 Big Data Trends for 2024 and Beyond
Speed, scalability, governance, and cost-effectiveness contribute to relevant, actionable, and impactful data insights.
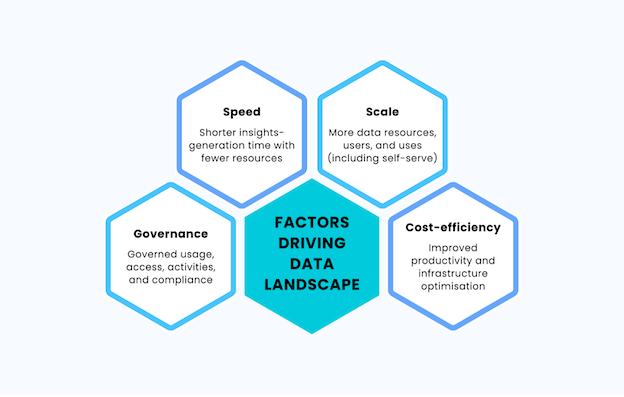
| Speed | Scale | Governance | Cost-efficiency |
| Shorter insights-generation time with fewer resources | More data resources, users, and uses (including self-serve) | Governed usage, access, activities, and compliance | Improved productivity and infrastructure optimisation |
Source: https://www.atscale.com/blog/defining-the-modern-data-landscape/
Here are six ways in which these four factors will cause big data to evolve in the near and long term:
1. IoT Integration with Big Data and IoT Network Growth
The Internet of Things (IoT) refers to the network of physical devices (computers, home appliances, and sophisticated monitoring machines at an establishment or location) connected via the internet. They can collect, receive, and send data through the software and sensors they contain.
A Statista forecast shows the number of IoT devices worldwide growing to 32.1 billion in 2030, more than double the 15.9 billion recorded in 2023.
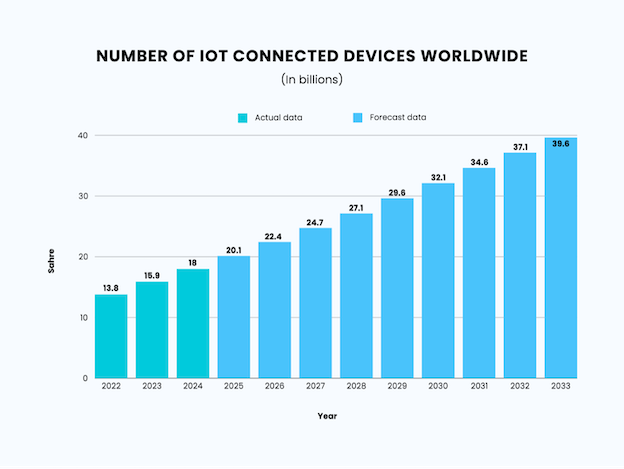
| Year | Number of IoT Connected Devices Worldwide |
| 2022 | 13.8 billion |
| 2023 | 15.9 billion |
| 2024 | 18 billion |
| 2025 | 20.1 billion |
| 2026 | 22.4 billion |
| 2027 | 24.7 billion |
| 2028 | 27.1 billion |
| 2029 | 29.6 billion |
| 2030 | 32.1 billion |
| 2031 | 34.6 billion |
| 2032 | 37.1 billion |
| 2033 | 39.6 billion |
Source: https://www.statista.com/statistics/1183457/iot-connected-devices-worldwide/
Big data tools can process vast raw information streams to extract real-time patterns and trends about machine performance, user behaviour, and environmental conditions. These insights can then help companies improve operational efficiency or services and predict trends. As a result:
- Manufacturers can predict equipment maintenance needs.
- Hospitals can provide better patient care and detect diseases early.
- Retailers can personalise the customer experience.
- Farmers can enhance crop yields and reduce waste.
- Cities can enhance traffic management, public safety, and energy use.
According to IoT Analytics, IoT continues to be among the corporate investment priorities, ranking second or third behind AI. The top three technologies making up almost 80% of all 2023 IoT connections were Wi-Fi, Bluetooth, and cellular IoT (2G to 5G, NB-IoT, and LTE-M). Meanwhile, 51% of enterprises involved in IoT Analytics’ Summer 2024 report said they plan to raise their IoT budgets in 2024. The increase is up to 10%+ for the 22% of the companies with such plans.
IoT is predicted to be worth $153.2 billion by 2029—up from $64.8 billion in 2024—with an 18.8% CAGR.
2. Industry-Specific, AI-Driven Insights in Real Time
While big data analysis tools address specific industry needs, all sectors benefit from improved decision-making, customer experience, operations, and budgeting.
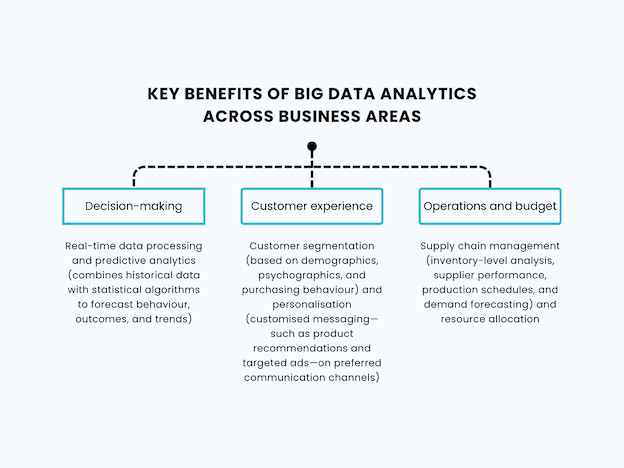
| Business Area | Benefits From Big Data Analysis |
| Decision-making | Real-time data processing and predictive analytics (combines historical data with statistical algorithms to forecast behaviour, outcomes, and trends) |
| Customer experience | Customer segmentation (based on demographics, psychographics, and purchasing behaviour) and personalisation (customised messaging—such as product recommendations and targeted ads—on preferred communication channels) |
| Operations and budget | Supply chain management (inventory-level analysis, supplier performance, production schedules, and demand forecasting) and resource allocation |
Source: https://blog.emb.global/big-data-analysis-tools/
Meanwhile, here are some specific ways big data and its analysis impact industries.
| Industry | Impact |
| Healthcare | Electronic health records enable patient data analysis for clinical decision-making, health risk identification for early intervention or disease prevention, personalised care plans, population health management, medical research innovation |
| Manufacturing | Sensors on machinery help identify bottlenecks and other anomalies to address or reduce defects. This prevents downtime and enhances product quality. Meanwhile, you can track inventory, delivery, and product demand for better customer satisfaction through supply chain monitoring. |
| Retail | In-store sensors and cameras can collect data, which big data tools can analyse to determine popular product areas and foot traffic patterns. Retailers can also use historical sales data and market trends to optimise product pricing and inventory levels, predict future demand, and minimise overstocking. |
| Finance, banking, and securities | Big data analytics can spot potentially fraudulent activities, improve credit risk assessment, and personalise investment strategies. |
| Logistics | Transportation management systems use big data sources to optimise routing, supporting more efficient and safer cargo movement. |
| Telecom | Analytics outcomes provide the basis for dynamically adjusting service pricing based on network conditions and demand dynamics. Findings also allow providers to predict customer needs, improving offers and customer retention. |
| Education | When students can access learning management systems, faculty can track their progress. Meanwhile, schools can use big data sources to evaluate teachers’ performance. |
Sources: https://bytehouse.cloud/blog/relationship-bigdata-and-iot,https://datafloq.com/read/the-future-of-big-data-trends-and-predictions-in-2023/, https://blog.emb.global/big-data-analysis-tools/, https://eyer.ai/blog/the-use-cases-for-anomaly-detection/, https://www.simplilearn.com/tutorials/big-data-tutorial/big-data-applications
3. Diversified Data Storage Options
Data silos are a challenge faced by 60.9% of organisations. As an industry response, two models have emerged to break them down and improve storage and access—the centralised data fabric architecture and the decentralised data mesh. However, the two frameworks aren’t mutually exclusive. Many companies typically use a hybrid model to leverage each system’s strengths.
The data fabric approach integrates data from diverse sources—databases, cloud services, and data lakes—and makes it accessible from one place. A centralised platform simplifies compliance and security. However, data operations can be rigid and block any cultural disruption.
Meanwhile, a data mesh infrastructure treats data as a product owned and managed by individual business departments or “domains” that generate and consume it. The distributed nature of data ownership allows domains to build products tailored to their needs and make decisions with more agility. However, strong coordination is necessary to ensure interoperability and consistency.
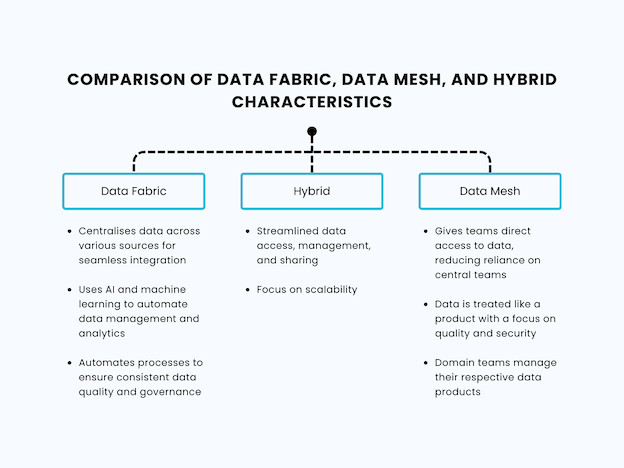
| Data Fabric | Hybrid | Data Mesh |
|
|
|
Inspired by: https://dualitytech.com/blog/data-mesh-vs-data-fabric/, https://www.precisely.com/blog/datagovernance/unraveling-the-threads-data-fabric-vs-data-mesh-for-modern-enterprises, https://shelf.io/blog/data-mesh-and-data-fabric/
Edge computing has been described as a mesh network of “micro-data centres” that processes and stores data locally or within a network before sending bundled relevant data to the cloud. This setup is ideal when data is physically close to the users who generate and use it. Internet-enabled or IoT devices are edge computing tools, which can lower network latency or duration between data generation and processing. Healthcare and retail are prime candidates for this type of computing because real-time data processing is crucial to their operations.
4. Quantum Computing

Regular computing uses a binary system, wherein each bit is either a zero or a one. Meanwhile, quantum computing uses quantum bits or “qubits,” which can be both numbers simultaneously. The qubits’ ability to exist in multiple states simultaneously allows them to analyse or perform highly complex calculations involving large datasets at unprecedented speeds.
Such capability has applications in medicinal drug development, simulating the interaction of molecules. Because quantum computing can crack regular codes, it can help efforts to strengthen encryption for improved data security. Moreover, quantum-enhanced machine learning (ML) systems can develop models from analytics to more accurately predict stock market trends, disease outbreaks, and weather patterns. Google, IBM, and Cambridge have begun quantum computing projects to power ML models for real-world applications.
According to QuEra Computing, the majority of its 900+ poll respondents believe the top two drivers of quantum computing’s ROI are its ability to solve previously unsolvable problems and do it faster than classical computing. However, responses were varied based on segments.
| Source of Quantum Computing ROI | Company member who uses/is a potential user of quantum computing | Member of a quantum computing business | Academe | Analyst or member of the press | Enthusiast |
| Solve previously unsolvable problems | 82 | 99 | 227 | 13 | 72 |
| Solve problems faster than classical computing | 70 | 79 | 178 | 9 | 68 |
| Optimise existing operations | 59 | 63 | 113 | 7 | 47 |
| Develop new intellectual property | 35 | 80 | 103 | 6 | 22 |
| Innovation and product development | 58 | 94 | 133 | 4 | 59 |
| Novel academic publications | 19 | 56 | 247 | 5 | 19 |
| Energy savings relative to classical computing | 36 | 46 | 81 | 7 | 39 |
| Other | 5 | 4 | 12 | 0 | 4 |
5. Data Visualisation
Data visualisation has become a key facet of data democratisation or the granting of data analytics access to non-IT/technical staff. Tools that turn data into charts and other visuals make the information easier to understand as they immediately highlight what matters.
Moreover, AI-enabled tools let users ask questions using natural language (e.g., “What are my three top-selling products in the last quarter?”) for more customised results. As a result, marketing people and others without deep technical knowledge can make informed decisions and identify opportunities.
When presenting data to stakeholders, developing stories around statistics becomes more convenient and appealing through customisable charts, pre-designed templates, or interactive maps. Software can now display these figures in 3D using VR or AR for a more immersive experience.
Also, interactive dashboards with streaming or real-time visualisations may soon become the norm. These tools allow you to explore data in more detail and enable you to perform other functions while viewing graphs. For instance, you can sell a particular stock when it hits a price threshold.
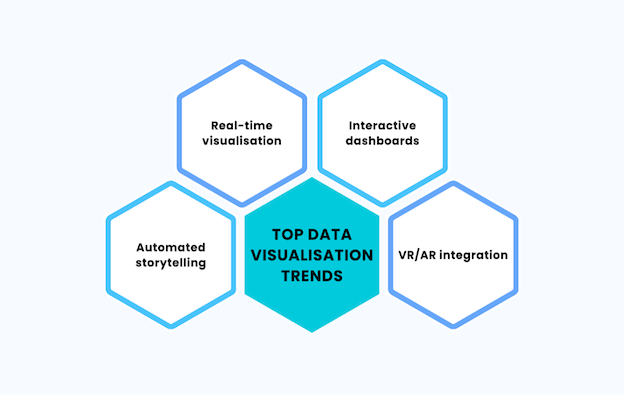
| Top Data Visualisation Trends: |
| Real-time visualisation |
| Interactive dashboards |
| Automated storytelling |
| VR/AR integration |
Sources: https://www.ingentis.com/blog/trends-data-visualization/, https://www.kellton.com/kellton-tech-blog/top-emerging-data-visualization-trends
6. Data Stewardship
Stronger data governance overshadows AI when it comes to long-term business viability moves. Around a third of survey respondents in Immuta’s 2024 State of Data Security Report said that security controls top their organisational initiatives. Data architecture modernisation (22%) and AI integration (20%) came in second and third. Amid the excitement about how AI can improve operations, including data privacy, 56% of data professionals fear that AI prompts used by employees can inadvertently expose sensitive company information.
Moreover, companies continue to come under attack by cyber threats. In 2024, 60% of large companies, 48% of mid-sized firms, and 12% of small businesses experienced cyberattack-related data loss.
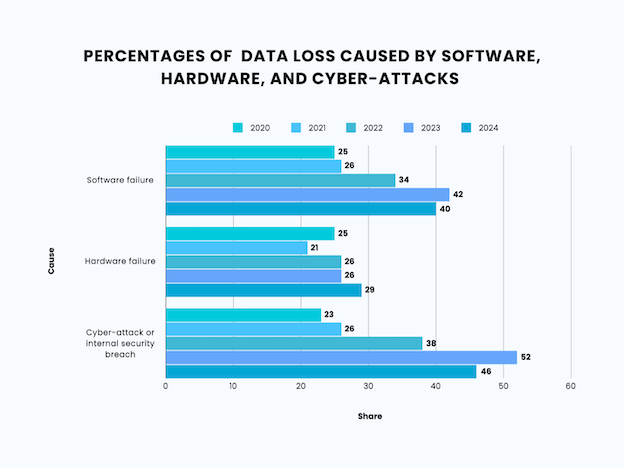
| Causes of Data Loss | 2020 | 2021 | 2022 | 2023 | 2024 |
| Software failure | 25% | 26% | 34% | 42% | 40% |
| Hardware failure | 25% | 21% | 26% | 26% | 29% |
| Cyber-attack or internal security breach | 23% | 26% | 38% | 52% | 46% |
Source: https://datahealthcheck.databarracks.com/2024/
At the same time, data governance is necessary to build trust. 73% of UK participants in a survey believe companies collect too much personal or financial data. The same percentage wants stronger protection of customer data once obtained. Britons also demand more transparency and regulation amid fears about unrestricted use of AI with their data.
Trust can make consumers more willing to share data, deepening data pools. However, they’re calling for disclosure over who their data is shared with and vetting of data security providers (77%).
Data use reporting has also become necessary to comply with regulatory frameworks (such as the General Data Protection Regulation in Europe and the California Consumer Privacy Act in the US) and support policy-making (such as the collaboration between the UK’s AI Council and various industries for the national AI strategy). Starting in 2024, the EU requires large and listed companies to report on the environmental and social impact of their activities as part of its sustainability directive.
6 Steps for Adapting to Emerging Trends
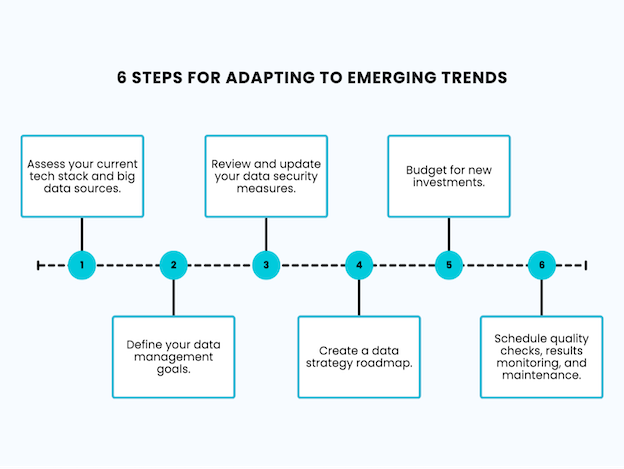
| Step 1 | Step 2 | Step 3 | Step 4 | Step 5 | Step 6 |
| Assess your current tech stack and big data sources. | Define your data management goals. | Review and update your data security measures. | Create a data strategy roadmap. | Budget for new investments. | Schedule quality checks, results monitoring, and maintenance. |
Sources: https://www.trinetix.com/insights/building-a-resilient-data-management-strategy-key-steps-and-best-practices, https://www.dataversity.net/data-strategy-trends-in-2024/, https://jake-jorgovan.com/blog/emerging-trends-in-big-data-analytics-what-businesses-need-to-know-for-the-future, https://www.avenga.com/magazine/trends-and-future-forecasts-in-big-data/, https://intelliarts.com/blog/building-big-data-strategy/
With executives under pressure to swiftly adapt to marketplace trends and show tangible impacts of their data planning, having a data strategy is vital to staying competitive and reaping the benefits of big data technology.
Here are six steps to help you achieve such a strategy:
1. Review your existing tech stack and big data sources.
Sit down with your IT team and assess and document your existing systems and capacities. Identify your big data sources—internal and external ones, as well as web and app-based analytics. Your future big data service provider or development team will need this documentation to assess your current situation.
2. Set your business objectives.
Know exactly what you want to achieve with your data. In defining your data processing needs, consider:
- The nature of the data you handle
- The volume of data you must process (Is it consistent or subject to seasonal fluctuations?)
- The complexity of your data processing tasks (Do they involve analysis, integration, and transformation?)
3. Assess and update your data security measures.
Revisit your data governance policies to ensure they comply with industry standards and relevant regulations: access controls, data encryption, proactive monitoring and detection, and backup and recovery. Proper documentation and audit trails should be SOP. At the same time, data protection protocols must promote honesty and accountability in data storage, collection, and use.
Nearly a third of firms worldwide have a chief data officer (CDO), whose top three roles include data governance. In the UK, 57% of businesses with revenues exceeding $50 billion have CDOs.
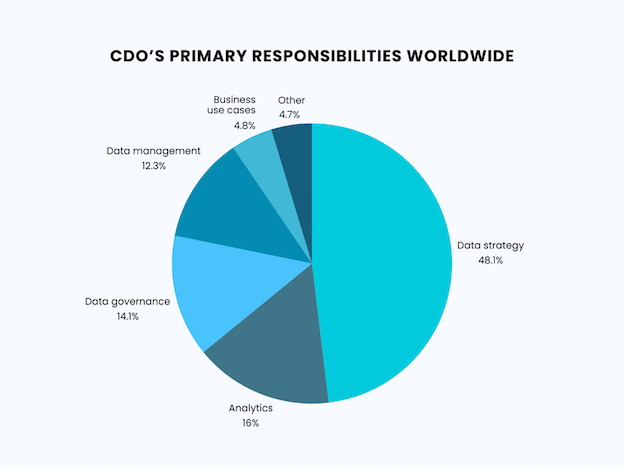
| CDO’s Primary Responsibilities Worldwide | Percentage |
| Data strategy | 48.1% |
| Analytics | 16% |
| Data governance | 14.1% |
| Data management | 12.3% |
| Business use cases | 4.8% |
| Other | 4.7% |
Source: https://www.statista.com/statistics/1362060/cdo-primary-responsibility-worldwide/
4. Create a data strategy roadmap.
This roadmap describes how your organisation will access, manage, and store data. It should provide a situational analysis upon which your business plots its data goals. Then it should discuss your tactical plans, timeline for implementing these measures, and monitoring/evaluation process.
5. Budget for new investments.
Investments should cover both technology and people. Equip your workforce with the skills to be data literate and proficient with the tools to manage and interpret data.
Once you’ve determined the level of support you’ll require from a service provider—whether it’s a data centre or data analytics agency—search, evaluate, and select based on their:
- Data specialisation and expertise
- Track record and reputation
- Data security and compliance
- Tools (check compatibility with your tech stack)
- Scalability
- Communication and collaborative approach
6. Schedule quality checks/results monitoring.
Conduct regular reviews to check how you’re getting value from your big data solutions. Evaluate the system or software based on performance efficiency, reliability, usability, and security.
Big Data Leadership Starts with a Forward-Looking Strategy
As technologies handling big data will continue to evolve, businesses should anticipate disruptions and keep pace with innovations to meet stakeholder demands. Staying informed of trends—like the points discussed above—can prepare you and your team to navigate the future with a data-driven mindset.