How Social Media Has Transformed in 2024
The impact of social media on our lives is undeniably powerful. For most of us, it’s almost impossible for a day to go by without using social media. But how did social media really start? In the 1990s, using a personal computer became somewhat normal. While the internet was developed in the 1970s, the art of sharing posts online started in the late 1990s. The first social networking site was called Six Degrees. The platform allowed people to connect through messaging. If you know the website Friendster, both sites share almost the same features.
Fast forward to 2024, around 5.17 billion people now engage in social media platforms, which is 63.7% of the global population. These numbers prove that social networking sites are now part of our daily routine.
Social Media Usage Overview
Social media use on a global scale
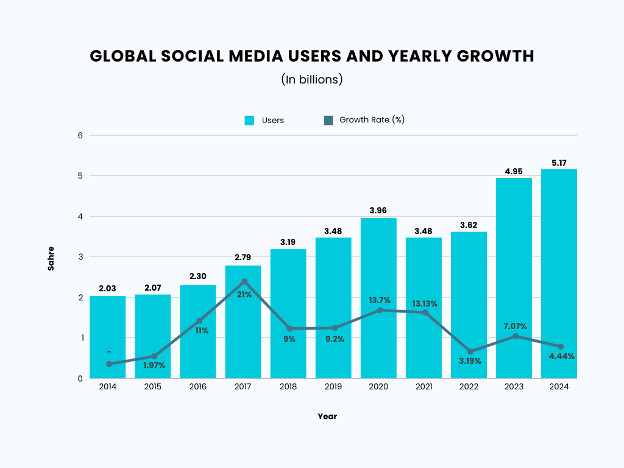
Back in 2014, there were 2.95 billion internet users, 2.03 billion of whom were active on social networking sites. Since there are currently 5.17 billion social media users in 2024, this is an increase of approximately 154.68% after 10 years. Now, in terms of the year with the most remarkable growth, the year 2017 has the highest, with a 21% increase in social media users.
Below is a breakdown of the growth of social media users globally from 2014 to 2024:
| Year | Social Media Users Globally | Growth in % Compared to the Last Year |
| 2014 | 2.03 billion | – |
| 2015 | 2.07 billion | 1.97% |
| 2016 | 2.30 billion | 11% |
| 2017 | 2.79 billion | 21% |
| 2018 | 3.19 billion | 9% |
| 2019 | 3.48 billion | 9.2% |
| 2020 | 3.96 billion | 13.7% |
| 2021 | 3.48 billion | 13.13% |
| 2022 | 3.62 billion | 3.19% |
| 2023 | 4.95 billion | 7.07% |
| 2024 | 5.17 billion | 4.44% |
Sources: https://backlinko.com/social-media-users, https://datareportal.com/reports/digital-2014-global-social-media-users-pass-2-billion-mark
Social media use per region
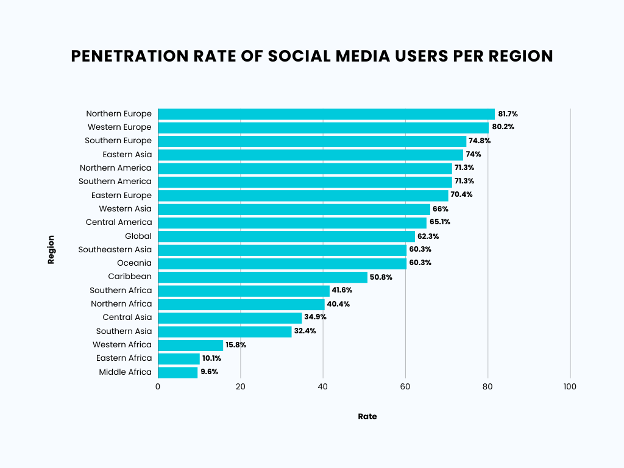
The social media penetration rate means active users versus the total population. As of April 2024, Northern and Western Europe are the leading regions in terms of social media penetration rates, with 81.7% and 80.2%, respectively. In contrast, Middle Africa has the lowest penetration rate, at just 9.6%.
Below is a breakdown of a bar graph showing the penetration rate of social media users per region:
| Region | Penetration Rate |
| Northern Europe | 81.7% |
| Western Europe | 80.2% |
| Southern Europe | 74.8% |
| Eastern Asia | 74% |
| Northern America | 71.3% |
| Southern America | 71.3% |
| Eastern Europe | 70.4% |
| Western Asia | 66% |
| Central America | 65.1% |
| Global | 62.3% |
| Southeastern Asia | 60.3% |
| Oceania | 60.3% |
| Caribbean | 50.8% |
| Southern Africa | 41.6% |
| Northern Africa | 40.4% |
| Central Asia | 34.9% |
| Southern Asia | 32.4% |
| Western Africa | 15.8% |
| Eastern Africa | 10.1% |
| Middle Africa | 9.6% |
Source: https://www.statista.com/statistics/269615/social-network-penetration-by-region/, https://techtipswithtea.org/data/social-media-users/
Demographics of Social Media Users
Apart from knowing how many people in the world have access to social networking sites, it’s also vital to understand the demographics of this population. The two of the most significant factors to look at are age and gender, which are crucial data for business, creativity, and research purposes.
Age of social media users
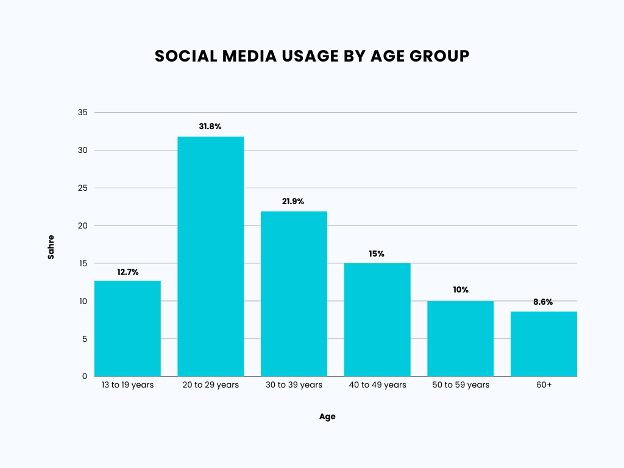
As of July 2023, users aged 20 to 29 are the most active on social media. On the other hand, those aged 60 and above, or the baby boomers, engage the least with social networking sites.
| Age Group | Percentage of Social Media Users |
| 13 to 19 years | 12.7% |
| 20 to 29 years | 31.8% |
| 30 to 39 years | 21.9% |
| 40 to 49 years | 15% |
| 50 to 59 years | 10% |
| 60+ | 8.6% |
Source: https://techtipswithtea.org/data/social-media-users.
Social media use by gender
Based on 2024 data, more than half of global social media users are male. In contrast, 46.6% of social media users are female, which is 6.8% lower.
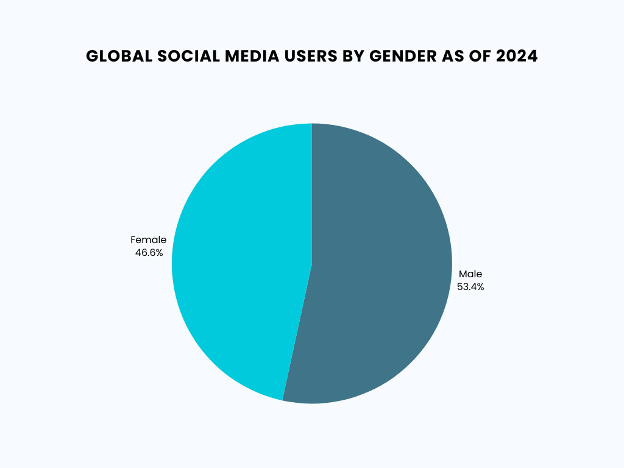
| Gender | Social Media Users in % |
| Male | 53.4% |
| Female | 46.6% |
Source: https://www.oberlo.com/statistics/social-media-usage-by-gender
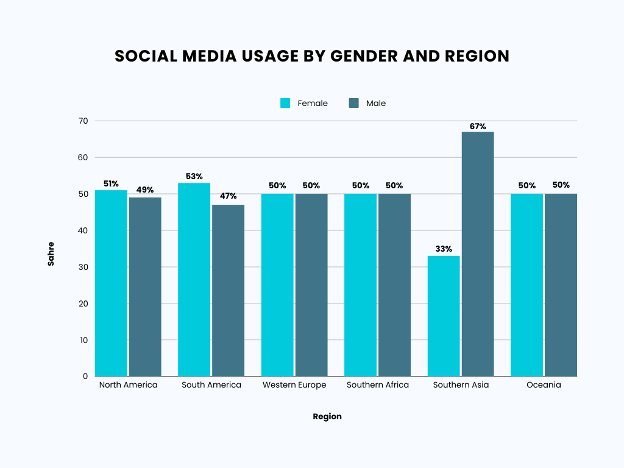
When it comes to social media user distribution by gender and region, there’s a significant disparity in Southern Asia. In this region, only 33% of users are male. In contrast, in North and South America, male users form the majority. Regions like Western Europe, Southern Africa, and Oceania show an equal gender distribution among social media users.
| Region | Male | Female |
| North America | 51% | 49% |
| South America | 53% | 47% |
| Western Europe | 50% | 50% |
| Southern Africa | 50% | 50% |
| Southern Asia | 33% | 67% |
| Oceania | 50% | 50% |
Source: https://seo.ai/blog/how-many-people-use-social-media
Social Media Platform Insights
Knowing which specific platforms online users spend the majority of their time on is valuable. Identifying the platforms where users are most active helps optimise marketing strategies, content creation, and audience engagement.
Top Social Media Platforms
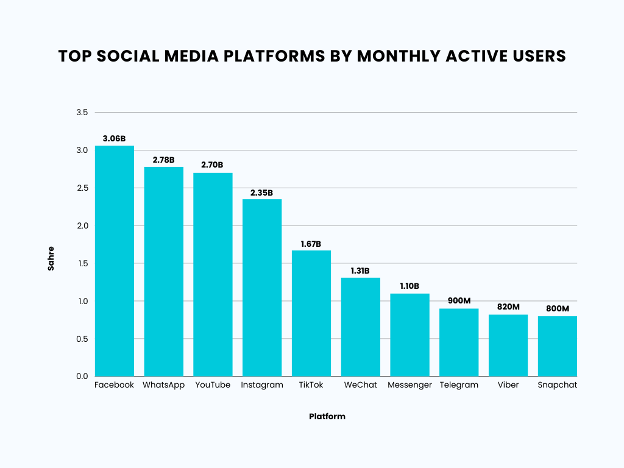
Facebook maintains its position as the most used social media platform worldwide. In 2004, Facebook hit 1 million users. Since its launch, Facebook has consistently attracted new users. Currently, this social media site boasts 3.06 billion monthly active users.
While YouTube has ranked next to Facebook in terms of having the most active users, it has recently been replaced by WhatsApp. WhatsApp has now amassed 2.78 billion monthly active users, while YouTube has 2.70 billion.
The graph below shows the top 10 most used social media platforms and their monthly active users.
| Ranking | Social Media Platform | Monthly Active Users |
| 1 | 3.06 billion | |
| 2 | 2.78 billion | |
| 3 | YouTube | 2.70 billion |
| 4 | 2.35 billion | |
| 5 | TikTok | 1.67 billion |
| 6 | 1.31 billion | |
| 7 | Messenger | 1.10 billion |
| 8 | Telegram | 900 million |
| 9 | Viber | 820 million |
| 10 | Snapchat | 800 million |
Source: https://explodingtopics.com/blog/top-social-media-platforms, https://verloop.io/blog/whatsapp-statistics-2024/#Number-of-WhatsApp-Users-Worldwide-, https://www.globalmediainsight.com/blog/youtube-users-statistics/
Emerging Social Media Platforms
While billions of people globally have relied on leading social media platforms since their inception, new and emerging platforms are gaining traction and are worth watching. Below are the top three emerging social media platforms you might want to check out:
1. Noplace
First on the list is Noplace, a text-based social networking site for the younger generation. By founding Noplace, CEO Tiffany Zhong aims to bring back the old social media way of sharing updates online without filters.
2. ten ten
While Noplace allows users to share textual posts, ten ten focuses more on audio messages. It brings back the childhood memory of communicating with your siblings and friends using a walkie-talkie. ten ten allows users to connect and send voice messages anytime, anywhere.
3. BeReal
If you’re looking for an app to help you capture your life’s moments, BeReal might be a good option. This app alerts users to take and share photos at random times of the day. As the name suggests, it encourages users to “be real” and share their authentic side with friends and family.
Social Media Usage Patterns
Waking up in the morning, grabbing your phone, checking your notifications and messages, and spending several minutes lying on the bed while browsing your feed is a familiar routine to most of us. This habit highlights that, on average, people now spend significant portions of their day on social networking sites.
Time Spent on Social Media
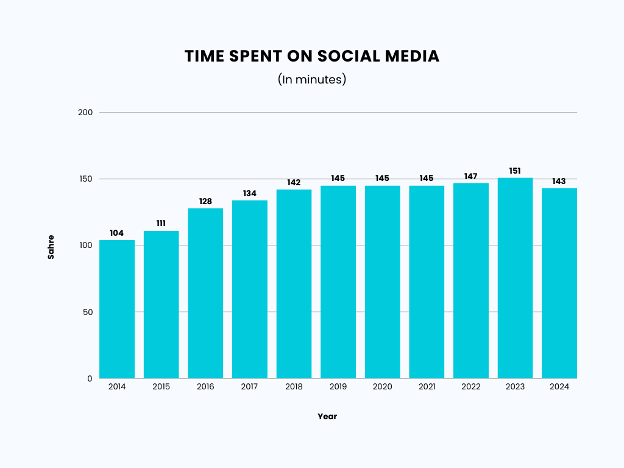
People from around the world used to spend 104 minutes or 1.73 hours of their day on social media back in 2014. Ten years later, global internet users now spend 143 minutes or 2 hours and 38 minutes daily on different social networking sites, which is 37.5% longer.
The graph below shows that in 2023, internet users spent an average of 151 minutes, or 2.52 hours, per day on social media, making it the year with the highest amount of time recorded so far.
| Year | Minutes |
| 2014 | 104 |
| 2015 | 111 |
| 2016 | 128 |
| 2017 | 134 |
| 2018 | 142 |
| 2019 | 145 |
| 2020 | 145 |
| 2021 | 145 |
| 2022 | 147 |
| 2023 | 151 |
| 2024 | 143 |
Source: https://www.statista.com/statistics/433871/daily-social-media-usage-worldwide/
Time Spent on Social Media by Gender and Age
While there are 6.8% more male social media users than females, recent data shows that females tend to spend more time on social media daily. This is particularly true among younger users, with those aged 16–24 averaging 2 hours and 55 minutes per day. The graph below also reveals that as age increases, the difference in social media usage between males and females becomes less pronounced.
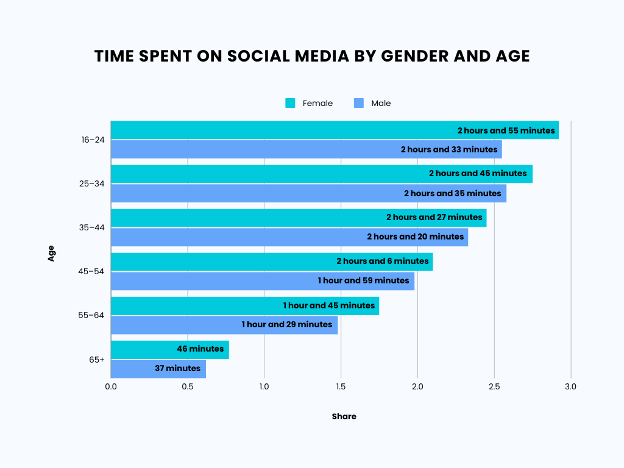
| Age group | Gender | Time spent on social media |
| 16–24 | Female | 2 hours and 55 minutes |
| Male | 2 hours and 33 minutes | |
| 25–34 | Female | 2 hours and 45 minutes |
| Male | 2 hours and 35 minutes | |
| 35–44 | Female | 2 hours and 27 minutes |
| Male | 2 hours and 20 minutes | |
| 45–54 | Female | 2 hours and 6 minutes |
| Male | 1 hour and 59 minutes | |
| 55–64 | Female | 1 hour and 45 minutes |
| Male | 1 hour and 29 minutes | |
| 65+ | Female | 46 minutes |
| Male | 37 minutes |
Source: https://www.oberlo.com/statistics/social-media-usage-by-gender
Time Spent on Social Media by Country
According to the Global Web Index 2023 report, Nigeria leads globally in daily social media usage, with an average of 3 hours and 49 minutes spent online each day. Among the top five countries, two are from Asia—the Philippines, where users spend an average of 3 hours and 36 minutes daily, and Indonesia, with an average of 3 hours and 10 minutes per day.
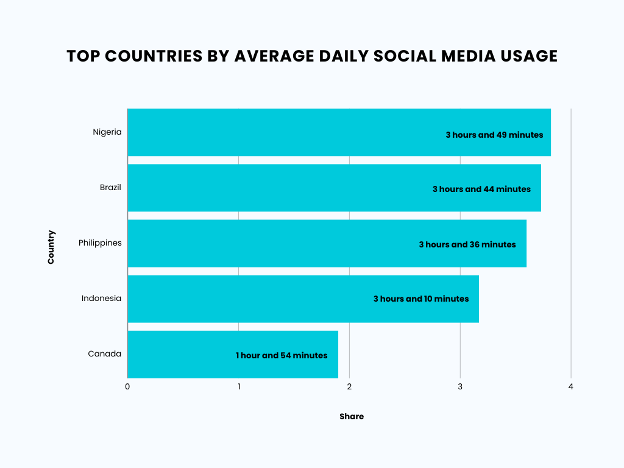
| Country | Average Time Spent Per Day |
| Nigeria | 3 hours and 49 minutes |
| Brazil | 3 hours and 44 minutes |
| Philippines | 3 hours and 36 minutes |
| Indonesia | 3 hours and 10 minutes |
| Canada | 1 hour and 54 minutes |
Source: https://smallaitool.com/social-media-use-and-growth-facts-technology/
Social Media Content Trends
Popular Content Types
In the early 1990s, as social media use began to rise, text-based content like blogging was the primary form of expression. Today, however, content creation has evolved to include a wide range of formats, including photos, videos, memes, GIFs, and more.
Moreover, short-form videos have become the dominant type of content on leading social media platforms. TikTok, known for its brief videos, caters to the shorter attention spans of today’s internet users. Following TikTok’s success, Instagram introduced “Reels,” and YouTube launched ”Shorts,” offering condensed versions of regular video content.
Time Spent on Short-Form Videos
How long should a video be to be considered short-form? Most short-form videos are typically under one minute. But anything not lasting more than 2 minutes and 30 seconds is also considered short. With this length, people’s attention is retained without being overloaded with information.
Below is a graph showing the average time spent on short-form videos per platform.
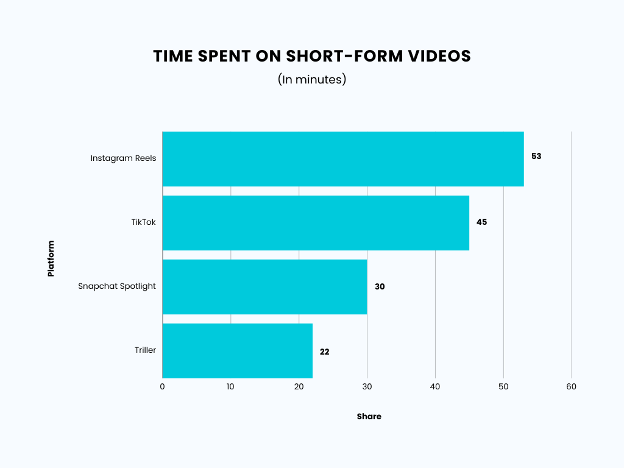
| Short Form Video Platform | Average Time Spent |
| Instagram Reels | 53 minutes |
| TikTok | 45 minutes |
| Snapchat Spotlight | 30 minutes |
| Triller | 22 minutes |
Peak Usage Times by Platform
Knowing when certain internet users are active is crucial, especially for marketers who want to maximise engagement by posting content at optimal times. By doing this, it helps their campaign be seen and reach a wider audience.
Let’s take a look at this table to see what times of the day people are online based on popular platforms.
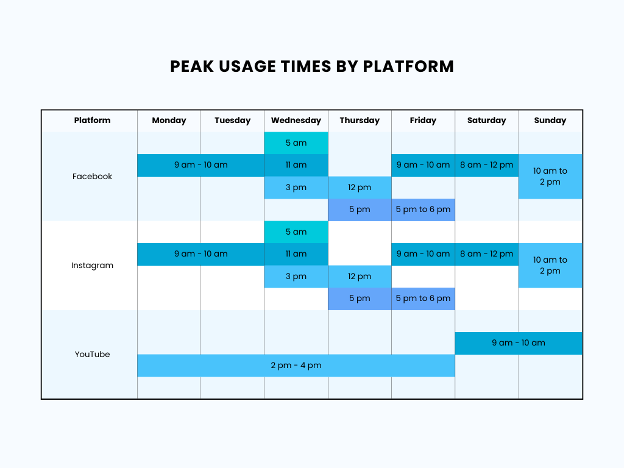
| Platform | Day | Peak Hours |
| Monday | 9 am – 10 am | |
| Tuesday | 9 am – 10 am | |
| Wednesday | 5 am, 11 am, and 3 pm | |
| Thursday | 12 pm and 5 pm | |
| Friday | 9 am – 10 am and 5 pm – 6 pm | |
| Saturday | 8 am – 12 pm | |
| Sunday | 10 am – 2 pm | |
| Monday | 9 am – 10 am | |
| Tuesday | 9 am – 10 am | |
| Wednesday | 5 am, 11 am, and 3 pm | |
| Thursday | 12 pm and 5 pm | |
| Friday | 9 am – 10 am and 5 pm – 6 pm | |
| Saturday | 8 am – 12 pm | |
| Sunday | 10 am – 2 pm | |
| YouTube | Monday | 2 pm – 4 pm |
| Tuesday | 2 pm – 4 pm | |
| Wednesday | 2 pm – 4 pm | |
| Thursday | 2 pm – 4 pm | |
| Friday | 2 pm – 4 pm | |
| Saturday | 9 am – 11 am | |
| Sunday | 9 am – 11 am |
Source: https://www.socialpilot.co/blog/best-times-to-post-on-social-media
The data shows that Facebook and Instagram users tend to be active at the same time each day. In contrast, YouTube’s peak hours differ only between weekdays and weekends, with users most active from 2 to 4 PM on weekdays and 9 am to 11 am on weekends.
User Preferences for Content Delivery Times
The days users are most active also play a crucial role in content absorption. Recent data shows that netizens are most engaged on Tuesdays, Wednesdays, and Thursdays. Conversely, Sunday is the least effective day to post on social media, as it tends to have the lowest engagement.
Social Media for Business
Businesses increasingly view social media as one of the most effective ways to connect with their target audience. In fact, 77% of businesses now use social media to reach customers.
Social Media Presence
When it comes to the percentage of marketers using various social media platforms for their businesses, Facebook stands out as the leading platform. Around 91% of organisations establish their online presence on Facebook. YouTube (90%) and Instagram (86%) are the other platforms where the majority of businesses have an online presence.
B2B vs. B2C
B2C companies often lean towards Facebook, Instagram, and TikTok for their marketing efforts. In contrast, B2B companies tend to favour LinkedIn and Twitter. This might indicate that B2C businesses prioritise engagement, visuals, and entertainment in their content, while B2B companies focus on informative and professional content.
Influencer Marketing Trends
In this digital age, social media influencers are modern-day celebrities. Their ability to reach and engage vast audiences has made them highly sought-after figures in various industries. No wonder 69% of consumers trust the recommendations that influencers make to them versus direct campaigns from companies. That’s why 90% of businesses leverage influencer marketing to their advantage.
Social Media Use by Device
The way we access social media has evolved over the years. With the rise of smartphones and tablets, and due to their portability, a growing percentage of social media users is shifting from desktop computers to mobile devices.
Mobile vs. Desktop Usage
Currently, 99% of people access social media on their mobile devices. This means that almost all social media users find it convenient to scroll through these networking sites using smaller devices. In addition, 78% of the social media population prefers to use mobile devices alone, while 1.32% prefer using desktops.
App vs. Browser Usage
Mobile users prefer apps over browsers. Around 90% of mobile users spend time on apps, while only 10% use mobile browsers. People find it more convenient to connect with others digitally using apps. Another factor is that most apps offer more features, while mobile browsers can be limited.
Smartphone mobile network subscriptions
By 2028, it’s predicted that global smartphone or mobile network subscriptions will reach almost 8 billion. In 2016, 3.7 billion subscriptions were recorded. As of 2024, there are 7.2 billion mobile network subscribers.
Here’s a graph of the smartphone mobile network subscription growth.
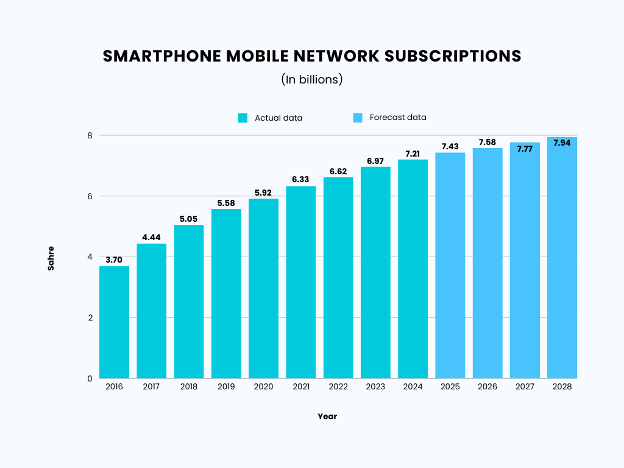
| Year | Mobile network subscriptions |
| 2016 | 3.70 billion |
| 2017 | 4.44 billion |
| 2018 | 5.05 billion |
| 2019 | 5.58 billion |
| 2020 | 5.92 billion |
| 2021 | 6.33 billion |
| 2022 | 6.62 billion |
| 2023 | 6.97 billion |
| 2024 | 7.21 billion |
| 2025* | 7.43 billion |
| 2026* | 7.58 billion |
| 2027* | 7.77 billion |
| 2028* | 7.94 billion |
*Forecasts
Source: https://www.statista.com/statistics/330695/number-of-smartphone-users-worldwide/
Smartphone unit sales
The global smartphone market grew by 6% in the second quarter of 2024, which is the highest year-on-year growth in the past three years. This growth is due to improved consumer sentiment and macroeconomic factors. As more consumers buy smartphones, the user base for social media platforms expands.
Leading smartphone vendors
Smartphone sales continue to skyrocket over the years, with the Apple brand leading the pack with a 20.1% share. Next is Samsung with 19.4% and Xiaomi with 12.5%. As these brands continue to sell more devices, more users are equipped with the latest mobile technology, enhancing their social media experiences through higher-quality cameras and processors.
The Future of Social Media
Outside of social media, AI tools have enhanced the way people work and create. In line with this, AI-generated content is also booming on various social media platforms. AI tools make it easier for people to create content. Businesses also benefit from this advancement, especially with the rise of AI-powered chatbots. These chatbots are designed to respond to online queries on social media platforms in the fastest way possible. So in the future, AI is likely to be an integral part of social networking sites.
Conclusion
One thing is certain: as younger generations grow up with social media, they’ll continue to shape its evolution, leading to potentially significant changes in how we communicate and engage online. So whether you use social media platforms for content creation, communication, or business, it’s crucial to understand social media’s evolution and its role in our lives today to stay relevant and effective in today’s digital landscape.